Meta
Benchmark and measure WhatsApp UPI payment load latency
- Digital Products & Software

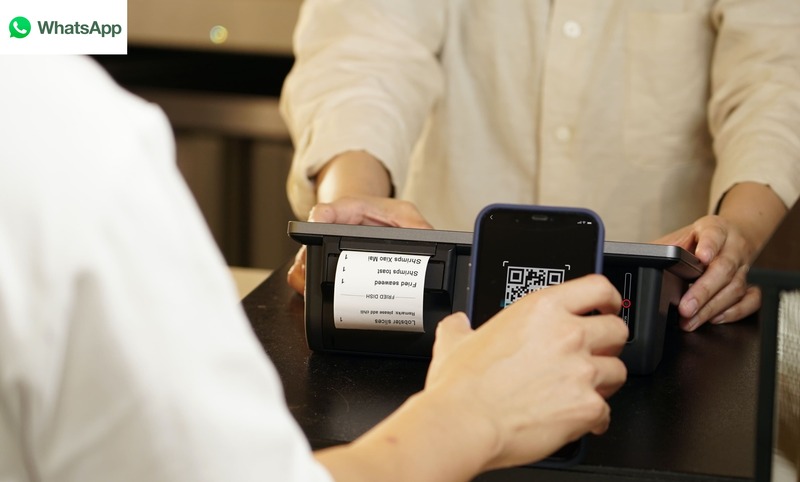
With the UPI market exploding, WhatsApp, the most popular messaging app installed on 2 billion devices, is trying to grab a larger market share. Being a new player, Whatsapp wanted us to benchmark its performance in terms of end-user latency against Paytm, Phonepe, and Google Pay.
We brainstormed the critical user journeys in the UPI payment spectrum such as scan & Pay, Pick QR code from Chat, pay to number etc and list of parameters such as telecom Type, Network type, first vs repeat transaction, distance & angle of scan and device types. These data points were captured during the project and various graphical representations were generated. Based on these the WhatsApp was able to benchmark their apps performance against other competitors.
How did we help?
#Benchmarking UPI Apps #UPI Latency Test #Automated Benchmarking Scripts
Auriga IT helped WhatsApp by writing automated scripts and running bulk iterations with different test configurations/conditions to generate a detailed report of the flow (the first to the last page, including the QR scanning time, Payment Completion Status Page etc.). We used different methodologies, Test conditions based on hardware and software configurations to compare them against all the popular UPI apps such as Phone Pay, Google Pay, Paytm & Amazon Pay.
Our team wrote automated scripts to simulate human behavior in the app to:
- Identify the flow and pages for which load latency needs to be captured.
- Write scripts in JAVA and identify elements from the page to capture load time.
- Execute the scripts with different Test configurations.
- Report generations
Technology – Javascript, SuperSet, MY SQL
Platform – Dashboard (Web-Based)
Auriga IT developed a detailed dashboard for WhatsApp Pay Team to analyze and get key insights from the benchmark study and get a clear page to the level of individual page loading time for different pages/steps during specific user journeys against popular payment apps in India. The dashboard has various filters to get a focused analysis of the data from the study.

We compared different apps in terms of steps and the time taken to complete a transaction. In this graph, different colors represent each step, and the block’s width represents the time taken in each step.

We also compared the efficiency of inbuilt QR scanners of various Payment Apps by measuring time taken to scan a QR code while varying angle (0 – 50 degrees) and distance (20 – 100 cm) of Scanning.

Highlights
Automated script to benchmark different UPI Payment Apps operating in India
Dashboard to compare each flow in UPI Apps
Related Case Studies

SLA Financials


